Household Debt Is Rising. What Does the New York Fed Report Tell Collection Agencies?
TABLE OF CONTENTS
The Federal Reserve Bank of New York released its latest household debt report on Nov. 10, and one number is getting plenty of attention: $19.1 trillion. That’s the total household debt reported in the United States at the end of the third quarter of 2026. Credit card balances reached $1.29 trillion, and the share of outstanding debt in some stage of delinquency also increased.
Those figures deserve attention. Behind them are millions of households managing mortgages, credit cards, auto loans, student loans and everyday bills. For some, those commitments are manageable. Others are working through difficult financial circumstances.
But the headline numbers don’t tell the whole story. The same report shows that transitions into serious credit card delinquency improved slightly compared with a year earlier. How can overall debt and delinquency rise while some measures of credit performance improve?
For collection agencies and accounts receivable professionals, that distinction offers useful context about the financial environment in which consumers make decisions.
What does the New York Fed household debt report measure?
The New York Fed publishes its Quarterly Report on Household Debt and Credit using anonymized credit report data. That information comes from its Consumer Credit Panel, a nationally representative sample drawn from Equifax records. The report tracks household borrowing across mortgages, credit cards, auto loans, student loans and other categories. It also looks at whether balances are current or past due, and how that changes over time.
Several of its measurements appear side by side, but they describe very different things.
Why can debt and delinquency rise while some measures improve?
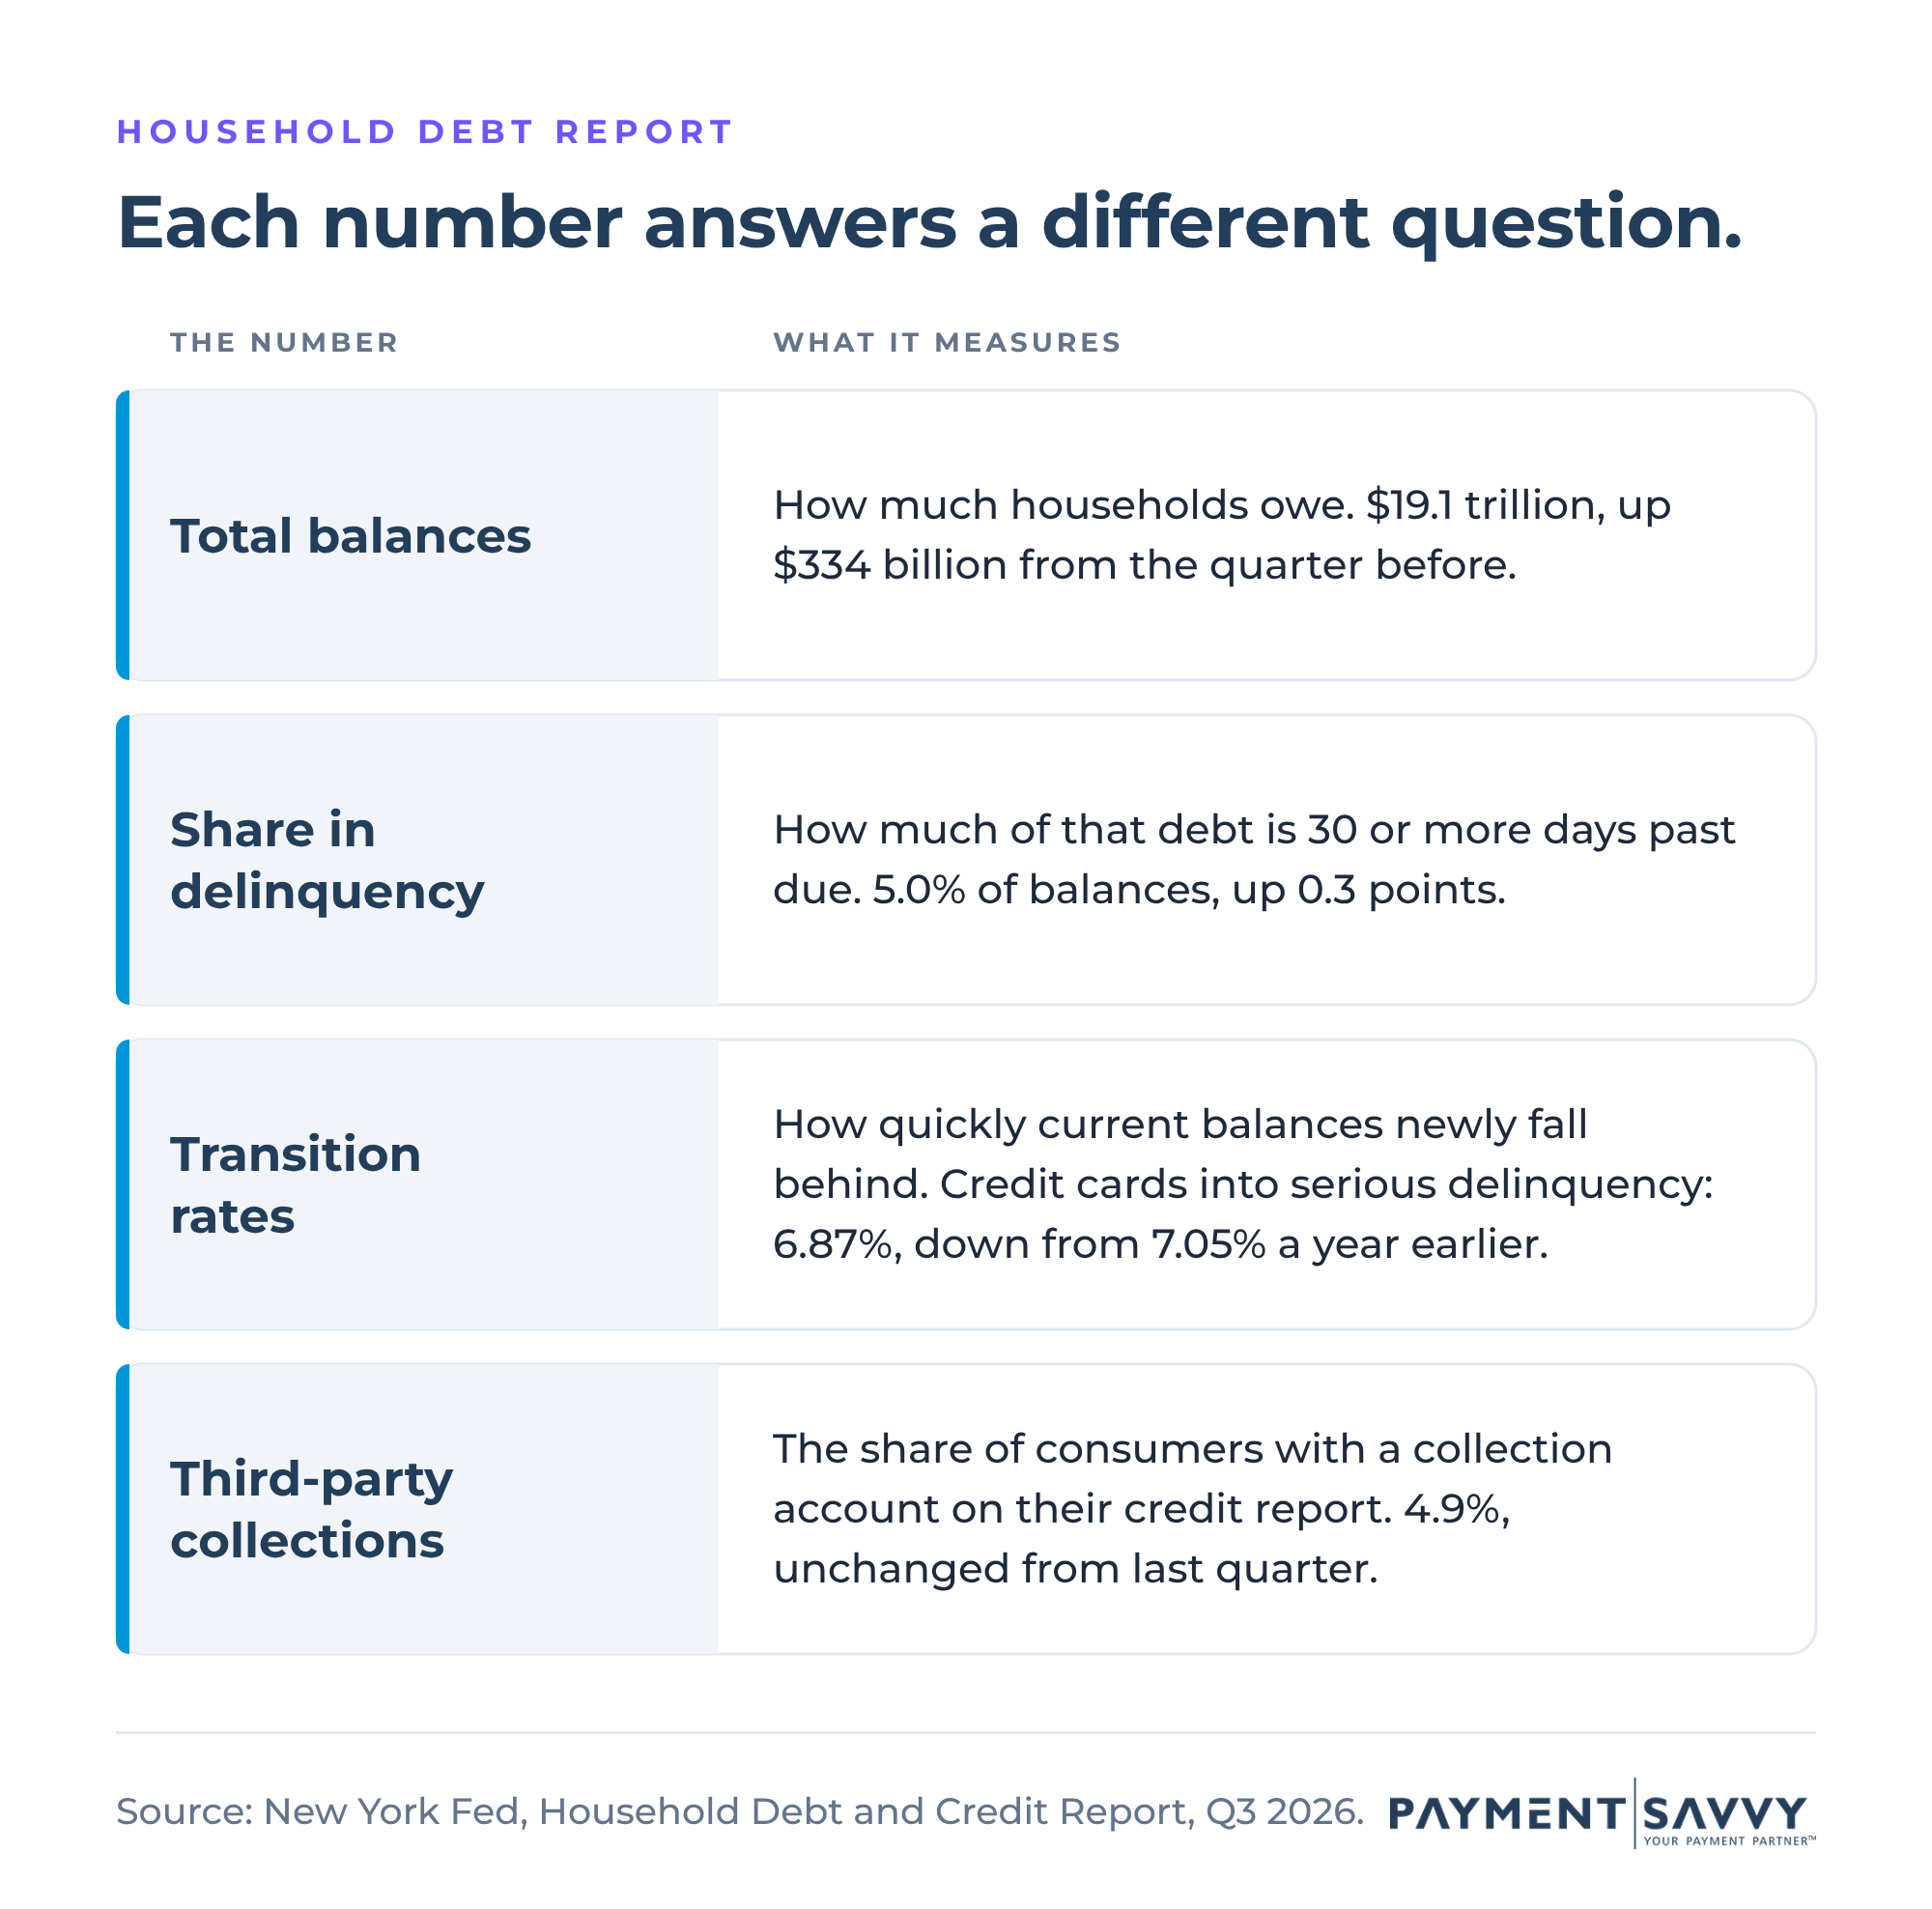
Because the report measures different things. Total balances show how much households owe. The delinquency share shows how much of that is past due, and transition rates show how quickly current balances are newly falling behind. Here’s how each one looked in the third quarter of 2026.
1. Total household debt: $19.1 trillion
Total household debt increased by $334 billion, or 1.8%, during the third quarter of 2026. Credit card balances reached $1.29 trillion, up $22 billion from the previous quarter.
An increase in outstanding debt doesn’t necessarily mean an equal increase in financial distress. Borrowing changes for many reasons, including home purchases, consumer spending and changes in how balances are reported. In fact, about half of the quarter’s increase in mortgage balances came from re-reporting. According to the New York Fed, those balances returned after a reporting gap in the previous quarter.
Total balances describe the scale of household borrowing. On their own, they don’t tell us how many consumers are struggling to make payments.
2. Debt in delinquency: 5.0%
At the end of September, 5.0% of outstanding household debt was in some stage of delinquency, up 0.3 percentage points from the previous quarter. This figure is the share of debt balances that are past due, not the percentage of Americans who have fallen behind.
That distinction matters because different types of debt carry very different balances. A change in mortgages or student loans can move the overall figure substantially. So it helps to look at each lending category. An increase in the overall rate doesn’t necessarily reflect the same conditions across every type of account.
3. Credit card delinquency transitions: a more nuanced picture
While the overall share of delinquent debt increased, credit card balances moving into serious delinquency improved slightly. Serious delinquency means balances newly reaching 90 or more days past due. The annualized transition rate for credit cards declined from 7.05% in the third quarter of 2025 to 6.87% in the third quarter of 2026.
That doesn’t mean credit card repayment difficulties have disappeared. It means fewer balances newly entered serious delinquency than in the same period last year.
Other categories tell different stories. The share of student loan balances at least 90 days past due rose to 10.9%, compared with 10.6% in the previous quarter.
What does the household debt report tell us about collections?
One figure that’s especially relevant to the accounts receivable management industry gets less attention in broader news coverage. According to the New York Fed, 4.9% of consumers had a third-party collection account on their credit report in the third quarter of 2026. That’s unchanged from the previous quarter.
It’s a useful measurement, but it has limits. The figure only reflects collection accounts included in credit reporting data, and changes in reporting practices affect comparisons over time. The three nationwide credit reporting agencies removed paid medical collection accounts from credit reports in 2022. Starting in April 2023, they also removed medical collection accounts with initial reported balances under $500. Changes in the share of reported collection accounts don’t necessarily match changes in the number of consumers managing outstanding balances.
Economic pressure also isn’t felt equally. A separate New York Fed analysis, released alongside the report, looked at credit card delinquency by neighborhood income. It found that the rise from 2022 to 2024 was steepest among borrowers in lower-income neighborhoods. National trends provide context, but they don’t say anything about any individual consumer’s ability or willingness to pay.
What the household debt report can’t tell us
The report describes where household borrowing and delinquency trends stand. It can’t tell us how an individual consumer will handle their obligations, or what next month will look like for them.
Circumstances change, and consumers are often balancing several priorities at once. Housing, transportation, healthcare and other essential expenses all shape how someone approaches an outstanding balance.
Agencies can’t control those circumstances. They can look at the experience they provide when someone is ready and able to make a payment. That includes clear communication, payment methods people already use, straightforward payment arrangements, and a confirmation once the payment is complete. Consumers use familiar options everywhere else, such as a debit card, ACH, or Apple Pay and Google Pay. Offering those choices can reduce unnecessary friction without adding pressure to an already sensitive situation.
Looking beyond the headlines
The New York Fed’s household debt report is a valuable resource for understanding consumer credit. Its greatest value comes from reading the numbers in context. For accounts receivable professionals, that means looking past the total amount of outstanding debt. It means paying attention to trends within each category, the differences between delinquency measures, and the limits of credit reporting data.
The quarterly findings can inform broader conversations. They don’t predict future collections activity or any one consumer’s payment behavior.
At Payment Savvy, we believe the consumer payment experience deserves that same thoughtful attention. We’ve focused on payment processing for collection agencies since 2011. To see how we work with agencies, visit our page on payment processing for collection agencies.
A report can tell us a great deal about household debt. A completed payment is the finish line, and a clear, simple way to pay helps more consumers reach it.
PAYMENT SOLUTIONS
FEATURED INDUSTRIES